18 Years of Priority-Date History: How Far Behind Is Each Green-Card Line?
We measured every employment-based Final Action date the State Department has published since January 2008 - 219 monthly bulletins - and turned them into one honest metric: how many years in the past each line's cutoff sits. EB-3 India once fell 15.7 years behind; EB-2 India hit its deepest backlog on record in June 2026 and then went Unavailable. The full 18-year story, with the record book.
We measured every employment-based Final Action date the State Department has published since January 2008 - 219 monthly bulletins - and turned them into one honest metric: how many years in the past each line's cutoff sits. As of the August 2026 bulletin, EB-3 India sits 12.6 years behind, EB-2 India is Unavailable after hitting its deepest backlog on record (12.7 years) in June, and the all-time record belongs to EB-3 India in September 2018: 15.7 years.
Raw cutoff dates are hard to read: "January 1, 2014" means nothing until you notice the bulletin saying it is August 2026. So this analysis plots backlog instead - the distance between each bulletin's month and its Final Action date. Zero means Current: no cutoff applies. A rising line means the queue is falling further behind real time; a falling line means it is genuinely catching up. Every number below is computed from the published bulletins, nothing else.
India: two lines, one direction
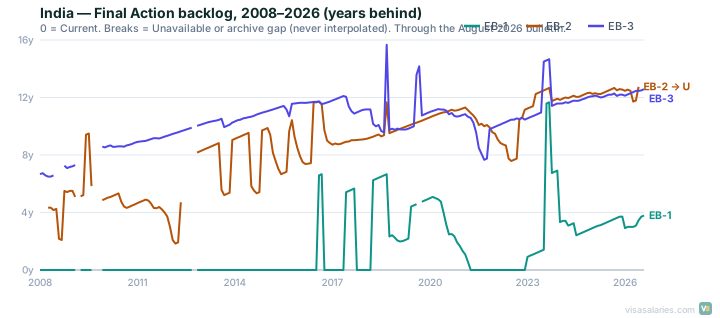
The India panel is the story most H-1B readers live inside, and it is brutal in both directions:
- EB-2 India started 2008 already 8 years behind, ground its way to 12.7 years behind in June 2026 - its deepest backlog in our entire dataset - and then the State Department stopped issuing numbers altogether: Unavailable in July, still Unavailable in August. The line on the chart simply breaks. That break is the honest rendering: there is no date to plot.
- EB-3 India holds the all-time record of the whole 18-year dataset: 15.7 years behind in September 2018. It has since "improved" to 12.6 years - improvement here meaning the queue is merely a dozen years long.
- EB-1 India, Current for most of the 2010s, produced the single most violent move we measured anywhere: in the August 2023 bulletin its cutoff fell by 3,684 days - just over ten years - in one month, from mid-2022 back to January 2012. Categories can retrogress without warning; that is what it looks like at full scale.
China: the long grind
EB-2 China peaked at 9.7 years behind in September 2015 and stands at 4.9 years in the August 2026 bulletin; EB-3 China peaked at 11.2 years in August 2015 and now sits at 4.6 years. China's lines rarely produce dramatic single months - with one exception. When fiscal year 2016 opened in October 2015, EB-3 China snapped back by 2,488 days (+6.8 years) after a mid-2015 retrogression - the largest single-month advance in the dataset. Same queue, same people; the cutoff just swung.
Everyone else: mostly Current, until it isn't
The rest-of-world columns spend long stretches at zero. EB-1 worldwide stayed Current for 68 consecutive months - December 2012 through July 2018 - the longest unbroken Current streak we measured. But "mostly Current" is not "always Current": EB-3 worldwide fell 7.5 years behind in late 2009, EB-2 worldwide hit 5.7 years in 2018, and in August 2026 EB-3 worldwide carries a real cutoff again, 1.9 years back. Worldwide applicants are not exempt from the math; they just feel it less often.
The record book, 2008-2026
Every record traces to a stored, published value - nothing estimated:
- Biggest single-month advance: EB-3 China, October 2015 bulletin - +2,488 days.
- Biggest single-month retrogression: EB-1 India, August 2023 bulletin - -3,684 days.
- Longest freeze on one date: EB-2 China held exactly June 8, 2019 for 10 straight months (October 2022 - July 2023).
- Longest Current streak: EB-1 worldwide, 68 months (December 2012 - July 2018).
What the fiscal-year heatmap shows
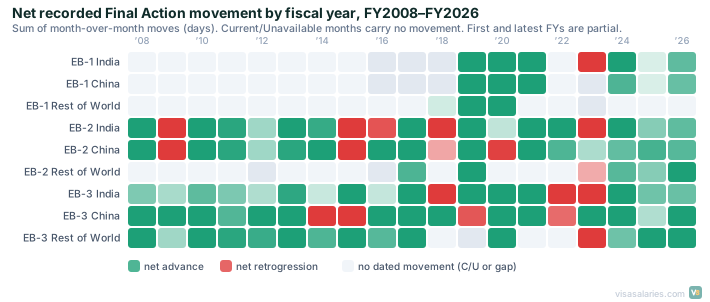
Summing each cell's recorded month-over-month moves by fiscal year (October-September) turns 18 years into one glance. Three patterns stand out. First, red clusters arrive in waves - FY2009, FY2015-16, FY2023 - because annual visa supply runs out in category after category at once, not one at a time. Second, big green years usually follow big red ones (FY2016's record advance undid FY2015's crash), so a single strong year is recovery, not progress. Third, EB-2 India's row alternates green and red for 18 straight years - net movement of +974 days in FY2008 against -1,430 days in FY2023 - while its backlog still ended deeper than it began. A queue can advance most years and still fall behind; that is exactly what a structurally oversubscribed category looks like.
Method, honestly
Backlog is simple arithmetic on published data: bulletin month minus that month's Final Action date, in years. "Current" plots as zero because no cutoff applies - we never fabricate a date for it. "Unavailable" and the five months in 2009-2012 the official archive does not serve are breaks in the line - never interpolated. Monthly movement is the calendar-day change in a cell's cutoff versus the previous bulletin, and a status change (a date becoming Current or Unavailable) is recorded as a status, not as movement. This report describes 18 years of published history; it does not predict any future cutoff, wait time, or green-card date - and given that the dataset contains a 10-year retrogression in a single month, you should treat anyone's projection with caution.
Live tables, the monthly archive, and each cell's full history: visasalaries.com/bulletin. The monthly composite reading built on this data: the H-1B Barometer.